1. UNPUBLISHED WORKING PAPER1
What Determines the Financial Margins on the Credits that Commercial Banks and
Development Banks Grant to the Private Sector in Mexico?
Marco Alberto Huidobro Ortega
Banco de México
Av. 5 de Mayo # 1- 6th floor
Col. Centro
México, D. F., 06059
ahuidobr@banxico.org.mx
Ernesto Sepúlveda Villarreal
Banco de México
Av. 5 de mayo # 1- 1st floor
Col. Centro
México, D. F., 06059
ernesto_sepulveda@banxico.org.mx
September 7, 2010
JEL: G21, G28
Keywords: Banks, Bank Lending, Banking, Commercial Banks.
ABSTRACT
We identify, measure, and compare the factors that determine the financial margin of the
loans that commercial and development banks grant to private businesses in Mexico. We
use data on more than 313,000 records of loans by December 2007. We found empirical
evidence of differences between the determinants of the financial margins of each type of
bank. Our results suggest that the development banks, unlike the commercial banks, do not
pursue an objective of profitability. Their most important contribution seems to be offering
funds at concessionary rates to financial intermediaries with the purpose of raising the
supply of credit in the Mexican economy.
1
The information, analysis, and opinions presented in this working paper are the sole responsibility of the
authors and should not be attributed to Banco de México.
2. 1. Introduction
The purpose of this work is to identify, to measure, and to compare the main factors that
determine the financial margin of the credits that commercial banks and development banks
grant to the private sector in Mexico. By development banks, we refer to those banking
institutions that are mostly or totally owned by the government, the purpose of which is to
foster the development of specific sectors of the economy. 2
The literature that highlights the relevance of financial development in economic
growth is extended.3 So it is its branch that focuses on the study of the main obstacles that
restrict the access to bank financing and of government interventions in the credit market
designed to overcome such inefficiencies. More specifically, such literature presents a case
for government intervention as long as it tackles a well identified credit market failure. 4
Although the discussion about the specific way the government intervention should
be is a debate not yet solved, a common intervention observed in many countries, including
Mexico, takes the form of development banks. To reconcile this practice with the economic
rationality behind the existence of such financial intermediaries, however, they should
exhibit some characteristics that clearly distinguish them, at least in some aspect, from the
way private banks operate.
The Mexican experience with development banks is not recent. Through the 20th
Century about 15 development banks and at least 30 development funds were created,
although they all have not coexisted simultaneously. By the end of the year 2008 only six
development banks and five development funds existed. From them, Nacional Financiera
2
The specialized literature in development banking defines it in many different ways. See Levy et al. (2004) and IDB
(2005).
3
See, among others, Fry (1995), IDB (2004) and Claessens (2006).
4
According to several studies (e.g., Stiglitz and Weiss (1981), Stiglitz (1994), Beck et al. (2004), IDB (2004), and
Claessens (2006)), this kind of government intervention might be justified as long as it mitigates the market failures that
restrict the access to credit. See also Fry (1995).
2
3. (Nafin), Banco Nacional de Comercio Exterior (Bancomext), Financiera Rural, and
Fideicomisos Instituidos en Relación con la Agricultura (FIRA) are the main responsible
for procuring bank financing mainly to small private corporations and individual producers
in Mexico.
For years the role of these financial institutions as promoters of the access to bank
financing by private persons and corporations has been questioned. Werner (1994), for
example, suggests that they operate to mainly grant credit to government corporations.
Armendáriz (1999) argues that some of these institutions do not share information, as they
should, to foster more financing from private banks to the private sector. More recently,
Benavides and Huidobro (2009) did not find evidence that such intermediaries facilitate
that the private banking system caters for new customers.
Following this debate, Cotler (2000) points out that if the development banking
system was allocation resources to sectors that suffer from low access to the credit of the
commercial banking system, it should be possible to detect the presence of significant
differences between the debtors from both systems. In the absence of any difference, the
character of development banks as a governmental response to ameliorate market failures
would fade. More specifically, if the development banks were simply replicating what the
commercial banks do, by definition, they would not be promoting neither a larger access,
nor increasing the efficiency in the credit market.
The empirical studies on the Mexican banking system, in addition to be scant, do
not offer elements to evaluate such differences. With this paper, we attempt to fill this gap.
To do so, we start putting forward the following hypothesis:
There are not relevant differences in terms of the characteristics of the debtors or
their loans between commercial banks and development banks in Mexico.
3
4. To test this hypothesis we focus on the analysis of the financial margins that the
Mexican banks charge on the loans that they grant. The relevance of studying the
determinants to the financial margins of the credits in each type of bank becomes clear
when we recognize that, in general, the development banks charge lower margins on their
loans than their counterparts in the private sector, yet it is not obvious why they do it.
Moreover, it is not clear whether the smaller financial margins that the development
banks charge respond to a strategy to minimize a market failure, such as the existence of
monopolistic structures, or to pursue social purposes, as achieving a better financial
inclusion.5 Maybe it is because these governmental financial institutions do not have
incentives to raise their profitability, or because they do not accomplish adequate risk
analyses, or because they obtain funds at lower interest rates, or because they lend to lower
risk debtors —those with collateral or guaranties—than private banks do, or else, because
they simply serve political interests. We do not know.
Levy et al (2007) state that: ―.the finding of profitable public banks may be
signaling the failure of the incentive scheme rather than its success. Pressures for
profitability… may induce public bank managers to deviate from their social mandate and
mimic private banks in their credit allocation criteria, in what Augusto de la Torre calls
Sisyphus syndrome. If so, public banks, although efficient, would become redundant.‖ A
possible way to test if government banks replicate the profit-maximizing credit allocation
criteria followed by private banks is comparing the way their financial margins react to
changes in the same set of loan and borrower’s characteristics.
In order to identify the main factors that determine the financial margin of the
credits that commercial banks and development banks grant to the private sector in Mexico,
5
See Sapienza (2004).
4
5. we use a multiple regression model with interactions. Following Suwanaporn (2003) and
Sapienza (2004), the financial margin (net interest revenues) is set as the dependent
variable. The characteristics of the credit (e.g. the type of lender institution, the existence of
collateral, and the purpose of the loan, among others) and the characteristics of the debtor
(e.g. whether he is a person or a corporation, his size, his economic activity, etc.) are the
explanatory variables.
We do not know any other study that uses such a rich micro database on bank
lending in Mexico as the one we use in this paper. We use hard data on more than 313,000
records of credits granted by private banks and development banks in Mexico in the year
2007, and more than 319,000 in 2008. The information has national coverage and
comprises credits to corporations, persons with business activity, and government entities.
It covers productive activities inside the agricultural, mining, manufacturing, industrial,
trade, services, and financial sectors.
The remaining of the paper contains four sections. In the second section, we
describe our database and explain the characteristics of the variables that will be included in
the econometric model, as well as the various adjustments that it was necessary to make the
database usable for our purpose. In this section, we also present a brief description of the
correlations among the variables and their ANOVA. In the third section, we present the
specification of the empirical model and the results we obtained. In the fourth section, we
present an exercise that verifies the robustness of the parameters estimated in the third
section. Finally, in the fifth section, we devote some paragraphs to sum up the obtained
results and to explain our findings and their implications.
5
6. 2. Data base, variables, correlations, and ANOVA
Data base and variables
The data used in this work come from the Reporte Regulatorio R04C (R04C) of the
National Banking and Securities Commission (CNBV), which captures information about
the commercial credits, that is, credits granted by private banks and development banks to
persons with business activity and corporations in the private sector, as well as to
government entities.
The records of this database come from 61 financial intermediaries: 53 commercial
banks and 8 development banks. A total of 1,695,646 individual credit entries were
included in December 2007. Of these, 43.6% corresponded to the commercial banking
system (739,266) and 56.4% (956,380) corresponded to the development banking system. It
should be noted that 98.3% of the records of the development banking system were granted
by one financial institution, Nafin, while 80.7% of the records of the commercial banking
system were granted by four large financial institutions. The above reflects the relatively
high level of concentration of the banking lending activity in Mexico.
Our database offers the advantage of enabling us to disaggregate some of the
characteristics of the debtors, and of the credits, that the Mexican banking system grants to
the private sector. In particular, it allows us studying the influence of these characteristics
on the financial margins of the credits.
We decided to use December 2007 as our baseline period for four reasons. First, the
quality of the information has improved continuously from the appearing of the first
records of this database in June 2001. The more recent the information, the better is its
6
7. quality and reliability. Secondly, the data reported to December are more reliable than the
data reported to any other month since, in order to be about the closedown of a calendar-
year experience, the information is subjected to scrutiny on behalf of the authorities, of the
investors and, also, of external auditors that diagnose the annual accounts of the banks.
Thirdly, December 2007 also offers the larger possible number of records of credits in the
period 2003-2008. Commercial credits registered a continuous expansion from 2003 to
2007, in the number of credits, in the outstanding amount, and as a percentage of the GDP.
Then they contracted around 8% in 2008, by the time the financial international crisis had
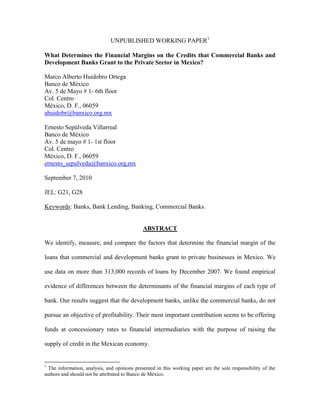
impacted the Mexican credit market (see Figures 1, 2 and 3).6 Finally, the data of December
2007 also offer the larger number of records of credits to micro debtors, which are a part of
the population targeted by the development banks.
In short, for the intentions of this study, December 2007 is a better period of
analysis than December 2008, and any other December from the previous years, since it
offers a larger number of total observations, and it includes a larger number of micro
debtors.7
The R04C Report was not designed for accomplishing economic research but to
regulate the banks. Because of this, it was necessary to refine the information to get a useful
database to estimate our econometric model. The first step was eliminating from the
original database the observations that were not relevant for this work. Table 1 describes
the observations that we removed.
Because the credits granted under a ―fixed interest rate formula‖ better reflects the
bank’s risk assessment of the debtor than the credits granted under a ―variable interest rate
6
See Banxico (2009.a, pages 82-90).
7
At this point, there is not available data for December 2009.
7
8. formula‖, the second step was discarding the latter (around 23.4 % of the observations). We
kept 1,219,589 credit records after we applied this filter.
It is important to make it clear that ―fixed interest rate formula‖ does not necessarily
mean that the interest rate charged by the bank keeps constant during the whole life of the
credit. What it means is that the determination of the rate follows a fixed formula during the
life of the credit. This fixed-interest-rate credit contracts facilitate the comparison among
the credits in terms of the risk assigned by the bank, regardless of another variables implied
by the level of the interest rate. Using the fixed-interest-rate-formula criteria also facilitates
the comparison of the credits in terms of the interest revenues that the banks obtain from
each type of credit.
The third step was eliminating the 676,172 records that corresponded to
withdrawals made to a single credit line granted by Nafin to the Trust Fund for the Savings
of Electric Power (FIDE). The FIDE is a fund that was created by the Mexican government,
through the Ministry of Energy and the Federal Commission of Electricity, in order to
foster the efficient use of the electric power in the country. This fund offers financing for
substituting old equipments and electric appliances in corporations and homes. Therefore,
since the FIDE is in reality a financial intermediary of the government, its credit records
were removed from our database. Our sample decreased to 543,417 entries with this
adjustment.
The fourth and last step consisted in avoiding duplicate records of credit. To do this,
we detected and grouped the balances of those credit entries that showed the same
characteristics in terms of the debtors and in terms of the characteristics of the loans. Even
though this measure cannot perfectly prevent the double counting of credits, it was very
useful and makes sense because in many cases the debtors have a credit line from which
8
9. they accomplish various withdrawals, and our database initially registered each withdrawal
as an independent credit. Nevertheless, all the records that showed any difference in terms
of the interest rate or any other characteristic of the loan, except relating to the balance,
were considered as different credits.
After the steps described above were undertaken, we ended with a sample of
313,985 observations: 307,313 credits of the commercial banking system and 6,672 credits
of the development banking system. Table 2 presents this information sorted by the size of
the debtors.
Table 3 explains the variables that we use to estimate our empirical model. From
our refined database, we constructed five variables. The first variable is the financial
margin (margin). This variable is calculated as the difference between the interest rate for
each credit and the average cost of funds for each type of bank. Notice that margin
constitutes a variable that encloses more information than the simple lending rate, since it
gives an indication on the profitability of every credit for the bank.
In the calculation of margin, we used the average cost of funding for each type of
bank, instead of the inter-bank overnight interest rate (TIIE), which better represents the
lending opportunity cost for the whole bank system. We did so because, for the purposes of
this study, it is important to detect any difference between the financial margin of the
credits granted by the development banks and those granted by the commercial banks. The
differences result, to a large extent, because the development banks, in fact, obtain funds at
a higher cost than commercial banks do. The private banking system raises funds cheaper,
mostly because they have a large network of branches to receive deposits from the public
while development banks hardly have this facility.
When using the TIIE as the financing cost for both types of banks, we might gain in
9
10. terms of getting a better indicator of the opportunity cost for the banks; however, we lose in
terms of the missed information about the different funding conditions each type of bank
faces. Besides, if we calculated the financial margin using the TIIE, the exercise would be
reduced practically to use the lending rate of the credits, what subtracts valuable
information from the analysis.8
Another variable that we constructed was the purpose of the credit (purpose). With
this variable, we tried to group the different purposes of the credits in categories according
to the nature or the aim of the loan, which normally is related to its maturity. For example,
a credit with the purpose to finance working capital is often a short term loan. In like
manner, a credit with the purpose to develop infrastructure has often a long term horizon.
From the locality where the debtor's domicile gets registered, we constructed the
variable location (location), which indicates if such locality is considered rural or urban.
Rural areas are those with a population no higher than 15,000 inhabitants.
We calculated the age of the debtors (age) as the difference between December 31,
2007, and the date read on the Federal Taxpayers' Registry (RFC) of the debtor, which
usually corresponds to the day when the person or the corporation was born. Finally, the
term of every credit (term), was computed as the difference between the expiration date of
the credit and the date when the first withdrawal of the credit took place. Both variables are
measured in days.
8
The results that came out from the estimation of the model when the variable margin was calculated from TIIE were
qualitative similar to the presented results.
10
11. Correlations and ANOVA
The lower triangle of Table 4 presents the correlations among all variables in
December 2007. Even though all the correlations proved to be statistically significant, the
more intuitive interpretations seem to be the ones between the variable margin and the
others. Although it is true that a second variable that yields interesting relations with the
others is term, it does not pose the same attractiveness as margin, since the greater part of
the bank credit in Mexico is granted for relatively short periods (up to five years). Notice
also that term and purpose are among the variables that produce the higher correlations
with other variables. Not surprisingly, between these two variables a high correlation is
detected.
The first interesting result is that the variable margin maintains a negative relation
with size (-0.406) as the theory predicts: larger debtors pay lower interest rates. And more
important, margin shows a positive correlation with bank (0.209), which means that
commercial banks charge higher financial margins on their loans than development banks.
When the debtor offers collateral, or when it is a corporation, the financial margin
tends to diminish, as their correlations suggest: -0.584 y -0.623, respectively. From here we
could think that, perhaps, banks perceive that a debtor that offers collateral is less risky than
a debtor who does not, and they also perceive that corporations are less risky than persons.
Two variables that seem to have a modest effect on financial margins are age
(-0.095) and balance (-0.042). These might suggest that, although the coefficients are
statistically significant, the age of the debtor and the standing amount of the credit barely
improve the risk assessment performed by banks.
The correlations indicate that, inasmuch as the debtors dedicate themselves to
activities that go from the primary sector (agriculture and mining) to the secondary
11
12. (manufacturing and industry), and from this to the tertiary one (trade, services and financial
services), the financial margin tends to increase (0.486). This phenomenon that seems
contrary to intuition can be the result of two reasons. On the one hand, most of the credits
granted to the agricultural sector (132,415 out of 133,457) were conceded by the
commercial banking system with second-tier funds either from FIRA or from Financiera
Rural. In other words, those credits were granted with government resources at
concessionary interest rates, although the final interest rate and the financial margin are
generally determined freely by the private bank.9 In addition, 132,682 of the agricultural
debtors offered some type of collateral. In fact, in December 2007, the agricultural sector
concentrated 81.2% of the total of collateral-backed loans (see Table 5).
With independence from the foregoing, it is reasonable to expect that activities like
trade and the services were relatively riskier than manufacturing or the industry, in part
because they are sectors that offer few guarantees.
Additionally, it seems that when the debtor is located in an urban area, when the
term of the loan is relatively length, or when the purpose of the credit is associated with
longer-term activities, financial margins diminish (correlations of -0.191, -0.531, and
-0.510, respectively).
In order to check thoroughly possible differences in the financial margins charged to
the credits, in Table 6a we present the Analysis of Variance (ANOVA) of all variables.10
9
As of December 2007, 131,846 out of the 133,445 records of credits granted by commercial banks to the agricultural
sector corresponded to micro debtors; the development banking system only reported seven micro and five small loans to
agriculture. This is natural given that, at the time, there does not exist a government first-tier bank financing the primary
sector. Notwithstanding FIRA and Financiera Rural channel second-tier funds to this sector.
10
Analyses based on ANOVA show several statistical limitations and that is why it is often preferred to use the
Multivariate Analysis of Variance (MANOVA). However, in this work it was not possible to use MANOVA because the
number of independent variables (10) and all the categories inside them (51) produced memory and cells requirements
(263,424 cells) beyond the limits of the statistical package employed [Statistical Package for the Social Sciences (SPSS)].
12
13. Once the existence of differences between the means was verified, we undertook the
Scheffé test to accomplish comparisons for all possible pairs of financial margin means.
It can be appraised that the economic activity of the debtor, the purpose of the credit
and the age of the debtor do not evidence the theoretical pattern expected. That is to say,
the coefficients do not show a negative, positive and negative effect, respectively, on
financial margins.
Therefore, perhaps for the arguments exposed above (the availability of government
preferential funds and collaterals), the agricultural sector enjoys the lowest financial
margins, very closely followed by the debtors of the financial sector, who pay financial
margins only 0.1 percentage points higher. From then on, in a way consistent with what
was detected in the correlation analysis, financial margins keep on growing as debtors
belong to primary, secondary and tertiary sectors. Trade and the services are the ones that
pay the higher average margins (7.3 and 8.5 percentage point, respectively).
In regards to the variable purpose, it is observed than the loans with purposes
associated to medium and long-term activities obtain lower margins than the credits that
back up short-term intentions. Relating to the variable age, the youngest debtors, with ages
up to a year, obtain the lowest margins, followed by the creditors in the 10-to-15-years-old
group.
The data indicate that the micro debtors face higher average financial margins in
7.4, 6.1 and 7.7 percentage point than the small, medium and large debtors, respectively. As
to the variable term, the banks charge on the average higher financial margins to the short-
term loans than to any other one. That way, the higher margins are applicable to the periods
from one to two years; followed by the credits granted up to a year. From then on,
13
14. excluding the credits in the 10 to 15 years term, financial margins diminish consistently as
the term of the loan increases.
The data seem to give sustenance to the idea that financial margins tend to diminish
when the banking institution belongs to the government, when the debtor offers a collateral,
when the debtors is a corporation (versus a person), and when it is located at urban zones.
Obviously, the most important difference for the purpose of this study is the one that arise
from the type of bank.
3. Model and Results
Our base model is a multiple linear regression model with 11 variables, of which seven are
qualitative and five are quantitative. The dependent variable is margin, which is
quantitative. From the independent variables, size, bank, collateral, person, activity,
location, and purpose are qualitative, and age, term, and balance are quantitative.
We chose this model for several reasons. First, we chose it because of its simplicity
11
and intuitiveness. Secondly, because the literature does not propose a better alternative.
Thirdly, because the result from the MWD test suggests that the linear model is at least as
good as the logarithmic-linear model. And fourthly, because the Ordinary Least Square
estimation is adequate for a cross-section database. Even though we found a
heteroskedasticity problem, it did not represent a serious obstacle to estimate the
parameters of the model.
Nevertheless, in order to allow for the possibility that some nonlinearity could
emerge between variables, further on we modify our base model. This nonlinearity is
11
Our proposed model shows similarities with those of Aportela (2001), Van Hemmen (2002), Suwanaporn (2003),
Galindo and Micco (2003), Sapienza (2004), and Beck and Demirgüc-Kunt (2006).
14
15. captured through interactions between pairs of the explanatory variables; specifically,
between the variable bank and the others, taken one at the time. Notice that it is precisely
from the estimate of these interactions where the empirical evidence to verify our working
hypothesis comes from. The estimation of these interactions constitutes a convenient
method to draw comparisons of the way commercial banks and development banks
determine their financial margins.
The following equation represents our base model:
margin β0 β1 size β2 bank β3 collateral β4 debtor β5 age β6 activity
(1)
β7 location β8 term β9 purpose β10 balance u,
where i (with i = 0,1,2,3…10) are the parameters to estimate by means of OLS.
All the estimated parameters proved to be significant at 99% of confidence. The
F-statistic also was pretty high (88,269), which mean that the explanatory variables, as a
whole, are statistically relevant to explain the variable margin. The adjusted R2 indicated
that the model explains 73.8% of the variations in the dependent variable. The signs of the
parameters in general gave results according to what the theory predicts, as we will discuss
ahead.
Although we did not detect the presence of multicollinearity, we found evidence of
heteroskedasticity. In order to take care of this problem, we practiced two independent
corrective measures. First, we estimated the heteroskedasticity-robust statistics of
equation (1). Second, we re-estimated this model by the method of Weighted Least Squares
(see Table 7a).
In regard to the first measure, it turned out that all the robust parameters resulted
statistically significant at 99% of confidence, so the problem of heteroskedasticity did not
seem to be very serious. Then we estimated the model by WLS, using alternatively as
15
16. weights the three quantitative variables (balance, term, and age). Again, all the estimated
parameters proved to be significantly different from zero at 99% of confidence. They were
pretty similar under the three mentioned specifications, and their signs did not change.
Since the estimation using the variable balance as the weight was the one that yielded the
best goodness of fit (0.734), it was the one we choose.
The results reported in the column II of the Table 7a are very similar to those
obtained through the estimate by OLS. Therefore, the negative effect of the presence of
heteroskedasticity in our model seems to be negligible. Based on the estimated parameters,
it can be said that:
a) The type of bank seems to be the variable that influences the most in the
determination of the financial margins that debtors pay. The debtors of the
private banking system pay considerably higher financial margins than those
financed by development banks. This could be consistent with what Kane
(1975) and others state: that government banks should offer financing at
preferential interest rates.12 However, part of the literature claims the
opposite.13
b) The type of debtor also seems to have an important influence on the financial
margin. When the debtor is a corporation, the financial margins decrease. This
finding is consistent with the idea that corporations are often considered as
12
IDB (2004), Grupo DFC (2002), United Nations (2005), and Stiglitz (1994).
13
McKinnon (1973), Benavente et al. (2005), Fouad et al. (2004), Fry (1995), Rojas and Rojas (1999), World Bank
(2008), Gale (1990), Bosworth et al. (1987), Aportela (2001), Sapienza (2004), Kane (1977), Raghavan and Timberg
(1982), and Cotler (2008).
16
17. lesser risky debtors than persons, or perhaps that in the case of the corporations,
the problems of asymmetric information are relatively less pervasive. 14
c) According to our model’s results, the size of the debtor plays a relevant role on
margin as the literature indicates. As the size of the debtor increases, the
financial margin decreases. They might be reflecting a higher risk perception in
small-size debtors.
d) Another factor that seems to have importance on the financial margins is the
purpose of the credit. Our results indicate that short-term credits (working
capital, sales, etc.) are more expensive than long-term credits (infrastructure,
fixed capital or imports).
e) The next most important factor that contributes to the determination of the
financial margin is the existence of collateral to support a loan. When there is
collateral, the financial margin falls, a result that is consistent with the
literature. 15
f) The economic activity of the debtor modestly influences the financial margin of
the loans. Estimates indicate that the debtors of the primary sector pay the
lowest margins, followed by those dedicated to industrial activities. The debtors
in the sector of services pay the highest margins.
g) The rest of independent variables, that is, age, balance, term and location, are
statistically significant, but they have minor impacts on margin. Indeed,
estimates suggest than the financial margin is too little sensitive, although with
the theoretically correct signs, to these four variables. Increases in the age of the
14
Akerlof (1970), Stiglitz (1994), Craig and Thomson (2004), Hallberg (2001), Stiglitz and Weiss (1981), Benavente et
al. (2005), Ponssard (1979), Vives (1990), IDB (2004), Levy et al. (2007), and Negrín (2000).
15
IDB (2004), Stiglitz and Weiss (1981), Bester (1985), Benavente et al. (2005), Rodríguez-Meza (2004), De la Torre et
al. (2007), Gelos and Werner (1999) and Voordeckers and Steijvers (2006).
17
18. debtor or in the balance of the credit cause on margin a decrease; at the same
time, margin increases with the term of the credit. The estimated parameter for
location shows that the urban debtors pay smaller financial margins than rural
debtors.
The estimated parameter for age could give support to what Beck et al. (2006) and
other state, i.e. that younger debtors (many of which are small size) confront more
problems to obtain banking financing. 16
The effect on margin from variations in balance proves to be much lower than what
some authors anticipate. We may have obtained this result as a consequence that most of
the bank loans in Mexico are short-term; therefore, their average balances are relatively
small, so they exhibit a limited range of variation.
In regard to the estimated parameter for the variable term, the positive sign could be
understood as a higher perceived risk associated to longer term loans.
Interactions between the explanatory variables and the type of bank
Because the most important differences detected in the financial margins are explained by
the variable bank, and because our hypothesis relies on such differences, it is crucial to
analyze the interactions between bank and all the other explanatory variables of the model.
Therefore, we estimated —using WLS— nine models that are similar to our base
model, except for that each of these models contains an additional explanatory variable.
This variable is the interaction between ―bank‖ and the other independent variables ( i ),
taken one at the time. Equation (2) shows these models:
16
Saurina and Trucharte (2004), Sapienza (2004) and Beck et al. (2006).
18
19. margin α0,i α1,i size α2,i bank α3,i collateral α4,i person α5,i age α6,i activity
α7,i location α8,i term α9,i purpose α10,i balance α11,i bank i v,
(2)
where i 1,3, 4,5,6,7,8,9,10 (remember that i 2 refers to the variable bank).
In Table 7a the columns III to XI exhibit the estimated parameters of the nine
models. Most of them are significantly different from zero at 99% of confidence —
including the correspondent interaction coefficients— and the goodness of fit is high in the
nine specifications.
Now, for illustrative purposes, consider the effect on margin of the variable size and
its interaction with bank. Both effects are expressed by equation (3):
margin 1.004 size 15.53 bank 2.344 bank size, (3)
where margin refers to the absolute change in ―margin‖. Based on the above equation,
and the estimated parameters, it follows that when the lender is a development bank
(bank=0), the financial margin diminishes in one percentage point if the size of the debtor
increases to the next higher category. Similarly, when the lender is a commercial bank
(bank=1), the financial margin is reduced by 3.3 percentage point by each increment in
size. This means the financial margins set by commercial banks are more sensitive than
those set by development banks with respect to the size of the debtor.
This does not mean, however, that commercial banks charge lower margins than
development banks. On the contrary, they charge higher margins to all size of debtors.
They charge 15.5 percentage point more to micro debtors (size=0),17 12.2 percentage point
more to small debtors (size=1), 8.9 percentage point more to medium-size debtors (size=2),
and 5.6 percentage point more to large debtors (size=3) than development banks do.
17
In December 2007 the average financial margin applied by development banks to micro debtors was set in five
percentage points.
19
20. Following the same sort of analysis, it can be shown the effects of the interaction
between bank and the rest of the variables. When the creditor is a development bank, the
debtors that offer collateral to support their loans pay a larger financial margin, in
approximately 0.5 percentage point, than those that do not. This result looks contrary to
intuition. In principle, it would be expected that the availability of collateral reduce the risk
in a credit, and this should be reflected in the form of smaller margins. Nevertheless, this
result might be biased, as only 17 out of more than 6,600 debtors, from the loans granted by
the development bank in our database, had guaranty. When the creditor is a commercial
bank, the debtors that offer collateral pay a smaller financial margin in approximately one
percentage point. However, commercial banks charge higher financial margins than the
development banks to a debtor with and without collateral, in 11.7 and 12.8 percentage
points, respectively.
Our estimates also point out that in the loans granted by development banks,
corporations pay a financial margin 7.2 percentage points smaller than persons. This might
be because corporations could be perceived lesser riskier than persons.18 The same thing
happens in the credits granted by the private banking system; persons pay a margin of 4.4
percentage point higher than corporations. Again, the financial margin charged by
commercial banks is superior to the one charged by development banks.
According to our calculations, development banks reduce their financial margins in
0.2 percentage point for every ten additional years in the debtor’s age, while the
commercial banking system reduces it in 0.03 percentage point. The above implies that the
age of the debtor is not an important factor in the determination of the financial margin of
18
However, the small number of persons financed by development banks (only 54) may bias this result.
20
21. the banks. The reason for this negligible significance might be that most of the debtors in
our database where 20 or more years old.
The evidence we found points out that when the lender institution is a development
bank, the financial margin rises in 0.2 percentage point with every category that the
economic activity of the debtor increases towards more sophisticated activities, that is, as
they pass from the primary sector to the tertiary. On the other hand, the commercial
banking system also increases the financial margin with the mentioned changes, but in 0.6
percentage point.
Development bank’ urban debtors pay a financial margin 1.7 percentage point
above the one that their 87 rural debtors pay. As for the private banks, it was found that
their debtors pay the same margin no matter where they are located.
Development banks increase their average financial margins in 0.4 percentage point
with every additional year in the loan’s term, while the private banking system does not
respond to this variable. The reason behind this result might be connected to the fact that
most of the credits in Mexico are granted to relatively short terms (up to five years).
Government-owned banks apply an additional 1.4 percentage point to the financial
margin to the loans which purposes are related to longer term aims or nature (such as
infrastructure, machinery, investments, etc.) versus those purposes connected to more
immediate intentions (working capital, sales or inventories financing, etc.). Faced with the
same circumstance, the commercial banks diminish its financial margin by 3.3 percentage
point.
Notice that the financial margin of neither type of bank reacts importantly when the
balance of the loan rises: the development banks increase its margin in 0.8 percentage
21
22. points, and private banks reduce it in 0.3 percentage points, with every 10 million pesos
increase in the loan’s balance.
4. Robustness
Do the relations between margin and the independent variables that we presented in the
previous section hold through time? This question is relevant, principally because, as we
mentioned previously, our estimates are based on cross-section data. In order to answer it,
we re-estimated our model but this time with data to December 2008.
Before presenting our results we should make a warning. To December 2008 the
financial international crisis had already broken out and the Mexican economy had begun
to suffer its effects.19 Similarly, the bank credit to the private sector in Mexico began to
change its composition. When comparing our database in December 2007 and December
2008, we observe three main differences:
1. The total number of credit transactions of both, commercial and development
banks, diminished due to the crisis. Nevertheless, once the correction to the
database that we explained to in section II was made, we got a total of 319,555
records in December 2008 (see Table 2). This figure is 1.8% larger to the one of
2007.
2. Not only commercial banks but also development banks moved away from
lending to micro-debtors and extended their lending to large and medium-size
debtors.
19
See Banxico (2009.b).
22
23. 3. Perhaps because the costs of funding increased, the average of the financial
margins of the Mexican banking system decreased in 0.4 percentage point,
which, ceteris paribus, implied a lowered profitability for the banks.20
The procedure to estimate the model for 2007 was followed suit in 2008. After estimating
the model in OLS, we discarded the presence of multicollinearity between the variables, but
we found the presence of heteroskedasticity. Therefore, we re-estimated the model
described by equation (1) using WLS. Likewise, because the higher adjusted R 2 again
corresponded to the specification in which we used the variable balance as the weight, we
selected this specification to go on with the analysis. The main results can be seen in the
column II of Table 7b and are the following:
In December 2008 most of the estimated parameters were significantly different
from zero at 99% of confidence, except for the coefficients related to the
variables location and term, whose statistical significance decreased to 90% of
confidence. Furthermore, it stands out that, except for the variable location, no
changes in the signs of the parameters were registered in spite of the crisis.
We constructed the t-statistic for each parameter estimated with the data from
December 2008 under the null hypothesis that they were equal to the parameters
estimated with the data from December 2007. With this test, we verified that,
except in the cases of the variables age, term and balance, as the crisis hit, the
20
From December 2007 to December 2008 the average cost of funding increased roughly one percentage point for
commercial banks and 0.7 percentage point for the development banks, so their average costs of funding ended this period
at 7.2% and 8.3%, respectively. Notice that the cost of funding of the commercial banking system increased more than the
cost of funding of the development banking system. However, the commercial banking system reduced its average margin
(in 0.4 percentage point) less than the development banking system (0.5 percentage point).
23
24. importance that the Mexican banking system gave to the other independent
variables in order to determine its financial margins was modified.
We observed a higher value for the constant, which could seem contrary to the
fact that, on the average, financial margins decreased. Nevertheless, such
increase could be a consequence of a change in the slope of the function of the
variable margin, which degree of response to some of the independent variables
of the model probably changed.
One of those variables for which margin probably changed its degree of
response is collateral. The estimated parameter for it almost tripled, what
suggests that, under a less favorable economic environment, the banks became
more sensitive to whether the debtor had any guaranty to support its loan or not.
In short, some of the estimated parameters of our model were modified in 2008, but
that did not change the sign of the relations among variables that we found out in the
previous section. That is why, in principle, our model seems to be robust in time. However,
of greater importance is to verify that the relations derived from the model with interactions
were still present by the end of 2008.
The results of the re-estimation of the equation (2), with the data as of December
2008, appear in the columns III to XI of the Table 7b. Next we briefly comment them:
The parameters associated to the variables location and term were practically
the only ones that proved to be little or negligible significant in statistical terms.
This result suggests that in 2008 the financial margins that the Mexican banking
system charged for its credits were not very different between urban and rural
24
25. debtors; neither they were very different among distinct terms of the loans, as
we mentioned in the previous section.
It continues to be valid the assertion that the financial margins that the
commercial banking system applies to credits are always much higher than the
financial margins of the development banking system.
In regard to the size of the debtor, for each category that increases the size the
financial margin decreases 3.1 percentage point if the lender is a private bank
and 0.7 percentage point if it is a development bank. Therefore, commercial
banks’ margin continues being more sensitive than government banks’.
Unlike development banks, commercial banks continued on rewarding, all the
more than in the 2007, when debtors offered collateral by reducing their
financial margins. In 2008 the commercial banking system collected a financial
margin of 9.4 percentage point to debtors that did not pledge collateral, but such
margin was reduced to 4.7 percentage point if there was a collateral to support
the loan (in 2007 the decrease was slightly above one percentage point).
The financial margin of the commercial banks in 2008 was lower for
corporations and higher for persons than in 2007. Therefore, in 2008 the margin
gap between corporations and persons widened in comparison to 2007 (4.2
versus 4 percentage points, respectively). The development banking system
charged 1.4 additional percentage points in the financial margin to corporations
versus persons in the 2008; in 2007 it rewarded the corporations with 7.2
25
26. percentage points lower than persons. This is the first qualitative difference we
found between both years.21
As in 2007, in 2008 the applicant's age was not an important factor in the
determination of the financial margin for neither type of banks.
Similar to 2007, in 2008 the commercial banks and the development banks
increased their financial margins as their debtors dedicated to more
sophisticated activities, that is, as they moved from the primary sector to the
tertiary sector. However, while commercial banks reduced the marginal
increase (from 0.6 to 0.3 percentage point), the development banks increased it
(from 0.2 to 0.4 percentage point).
Furthermore, the relations between margin and location observed in 2007
continued in 2008. They only changed somewhat in quantity: the urban debtors
of the development banks paid a financial margin one percentage point higher
to the one that rural debtors paid; the year before the difference was 1.7
percentage point. The rural and urban debtors of the commercial banks
continued paying roughly the same margin.
In 2008 the variable term stopped being relevant to development banks; in 2007
these banks slightly increased margin as the term of the loan increased (0.4
percentage point for every additional year). The private banking system
continued charging the same financial margins without making any difference
in response to different loan terms.
21
This result could be statistically more significant than its equivalent in 2007 as the number of financed persons by the
development banking system increased from 54 to 384. Besides, many of the firms that obtained credit from the
development banking system in the end of 2008 had severe liquidity problems due to the crisis, so it might be said that a
higher risk explains a larger margin.
26
27. From 2007 to 2008 the estimated effect of variations in ―purpose‖ on the
financial margins collected by development banks changed from 1.4 to -0.5
percentage points. In other words, in the latter year the government banks
charged a lower margin to the credits whose aim was targeting projects of
longer maturity, when in the former year it was just the opposite. This is the
second qualitative change that we found. The commercial banking system, on
its part, only moderated the reduction in its average margin, from 3.3 to 2.3
percentage point.
Finally, the effect of balance on margin only suffered minor changes in
magnitude for both types of banks: in 2008, the government banking system
reduced its margin by only 0.2 percentage points for every 10 million pesos
increment in the balance of the credits (the equivalent reduction in 2007 was
0.8 percentage points). Faced with the same increase in the loan balance, the
private banking system diminished its margin in 0.3 percentage point, very
close to the figure of 0.2 percentage point corresponding to 2007.
5. Final comments
We found empirical evidence that there are statistically significant differences between the
main determinants of the financial margins that the commercial banks and development
banks charge in their loans to the private-sector corporations and persons in Mexico, which
is why we reject the hypothesis that we presented in the introduction of this work.
For the above, we argue that the assertion that the lending activities of the
development banks are based on the same criteria that define those of the commercial banks
27
28. in Mexico does not have solid empirical justification. At least in what is referred to the
determination of financial margins.
However, we should make clear that from the previous argument, we cannot come
to the conclusion that the lending activities of the development banks in Mexico necessarily
lead to stamp out the asymmetries of information that make room for difficult access to
bank financing, or to credit rationing. What we can affirm is that the development banking
system performs a function that does not seem to respond to the principles of profitability
that guide commercial banks operations.
According to our results, the more relevant determinants of the financial margins
that the Mexican banks charge in their commercial loans are: 1) whether the bank that
grants the loan is a commercial bank or a development bank, 2) whether the debtor is a
corporation or a person that performs business activities, 3) whether the debtor offers a
collateral to support its loan, 4) the debtor's size, 5) whether the aim of the credit is related
to short term or longer term matters and 6) the debtor’s economic activity, all in that order.
The financial margins of the commercial banks are relatively more sensitive than
those of the development banks to changes in the following variables: collateral, person,
size and purpose. That is, the financial margins collected by private banks react more than
those collected by government banks if: (a) the debtor offers collateral, (b) who requests the
credit is a corporation instead of a person, (c) who requests the credit is a large debtor
instead of a middle or a small-size debtor and, (d) the purpose of the credit is associated
with, say, equipment or machinery financing rather than with working capital or sales
financing.
Even though the loan’s balance proved to be a statistically significant variable, the
magnitude of its estimated parameter was negligible. Therefore, it turned out to be of little
28
29. relevance to the determination of the financial margins in both types of banks.
In 2008, after the financial international crisis burst, the variables collateral and
debtor became more relevant to explain the level of the financial margins of the
commercial banks. This means that, during this period of financial turbulence, commercial
banks seem to have charged much lower financial margins to debtors that offered collateral
to back their credit, or to corporations instead of persons that hold business activities. By
the same time, the variables size, activity and purpose became less relevant for the
determination of financial margins for both commercial banks and development banks,
although they continued being important.
Thus, the most important findings of this article can be summarized as follows:
1. There are important differences between the debtors and between the types of
loans that the development banks and the commercial banks grant in Mexico.
2. However, some differences between the financial margins of each type of bank
are only a matter of degree or magnitude given that they point to the same
direction. Such is the case in regard to the size of the debtor.
3. It stands out that both types of banks barely finance younger than two year-old
debtors; on the contrary, they concentrate most of their loans in debtors aged 15
and above. Therefore, it looks like the government banks do not necessarily
promote access to credit among the younger applicants.
4. The main and most important contribution of the development banks in Mexico
seems to be the offering of funds to the private sector financial intermediaries
—commercial banks and other intermediaries— at concessionary interest rates.
These intermediaries use these funds to grant credit to corporations and
persons that undertake business activities.
29
30. 5. Therefore, our results seem to suggest than the development banks, unlike the
commercial banks, do not pursue an objective of profitability, but they seek to
raise the total offer of credit in the economy. They do so by offering second-tier
preferential funds –that is, lower cost funds- to other financial intermediaries.
Finally, it is important to make clear that even though the results obtained in this article are
statistically significant, they suffer from various limitations:
Our findings are based on cross-section analysis. Naturally, a richer analysis
could have come out if it was possible to apply a panel-data approach. That way
we would have followed up in time a same debtor. This certainly would have
thrown very interesting indications of how the credit market works.
The observations belonging to the development banking system represent
around two percent of the total of observations in our sample. As we mentioned
previously, this follows from the fact that the greatest part of its funds is
channeled through other financial intermediaries. As today there is not a
database that enables us to find out the terms in which these resources are
rendered by such financial intermediaries to the final debtors.
Had we had such a database, it would have allowed us to understand much
better the contribution of the development banks to the functioning of the credit
market in México. Unfortunately, at this point a database of that nature does not
exist.
30
31. References
Akerlof, George (1970), ―The Market for ―Lemons‖: Quality, Uncertainty and the Market
Mechanism‖, Quarterly Journal of Economics, Vol. 84.
Aportela, Fernando (2001), ―Corporations’ Financing Costs: The Role of Development
Banks in Mexico‖, Working Paper No. 113, Center for Research on Economic
Development and Policy Reform, Stanford University, November.
Armendáriz, Beatriz (1999), ―Development Banking‖, Journal of Development Economics,
Vol. 58, February.
Banco de México (Banxico) (2009.a), Inflation Report October–December 2008 and
Monetary Program for 2009, January.
Banco de México (Banxico) (2009.b), Annual Report 2008, April.
Beck, Thorsten, Asli Demirgüc-Kunt, and Vijoslav Maksimovic (2004), ―Financing
Patterns around the World: Are Small Corporations Different?‖ Mimeo, World
Bank, August.
Beck, Thorsten and Asli Demirgüc-Kunt (2006), ―Small and Medium-Sized Enterprises:
Access to Finance as a Growth Constraint‖, Journal of Banking and Finance, No.
30.
Beck, Thorsten, Asli Demirgüc-Kunt, Luc Laeven, and Vojislav Maksimovic (2006), ―The
Determinants of Financing Obstacles‖, Journal of International Money and
Finance, No. 25.
Benavente, José Miguel, Alexander Galetovic, and Ricardo Sanhueza (2005), ―La dinámica
industrial y el financiamiento de las PYME‖, Documento de Trabajo No. 201,
Centro de Economía Aplicada, Universidad de Chile, January.
Benavides, Guillermo and Alberto Huidobro (2009), ―Are Loan Guarantees Effective? The
Case of Mexican Government Banks‖, Well-Being and Social Policy, Vol. 5, No. 1,
México.
Bester, Helmut (1985), ―Screening vs. Rationing in Credit Markets with Imperfect
Information‖, The American Economic Review, Vol. 75, No. 4, September.
Bosworth, Barry, Andrew Carron, and Elisabeth Rhyne (1987), The Economics of Federal
Credit Lending, The Brookings Institution, Washington.
31
32. Claessens, Stijn (2006), ―Access to Financial Services: A Review of the Issues and Public
Policy Objectives‖, The World Bank Research Observer, Vol. 21, No. 2.
Cotler, Pablo (2000), ―El Comportamiento de la Banca de Desarrollo en México y su
Compatibilidad con la Política Económica‖, in El Futuro de la Banca de
Desarrollo: El Reto del Fomento Económico, Federalismo y Desarrollo, Año 13,
No. 69, July-August-September, Banco Nacional de Obras y Servicios Públicos,
México.
Cotler, Pablo (2008), ―La Oferta de Financiamiento para las Micro y Pequeñas Empresas en
México‖, Mimeo, Universidad Iberoamericana, September.
Craig, Ben, William Jackson, and James Thomson (2004), ―Are SBA Loan Guarantees
Desirable?‖ Economic Commentary, Federal Reserve Bank of Cleveland,
December.
De la Torre, Augusto, Juan Carlos Gozzi, and Sergio Schmukler (2007), ―Innovative
Experiences in Access to Finance: Market Friendly Roles for the Visible Hand?‖
Policy Research Working Paper No. 4326, World Bank, August.
Fouad, Manal, Richard Hemming, Davide Lombardo, and Wojciech Maliszewski (2004),
―Fiscal Transparency and State-Owned Banks‖, in Caprio, Gerard, Jonathan
Fiechter, Robert Litan and Michael Pomerleano (Editors), The Future of State-
Owned Financial Institutions, Brookings Institution Press, Washington.
Fry, Maxwell (1995), Money, Interest and Banking in Economic Development, Second
Edition, The Johns Hopkins University Press, Baltimore.
Gale, William (1990), ―Federal Lending and the Market for Credit‖, Journal of Public
Economics, Vol. 42.
Galindo, Arturo and Alejandro Micco (2003), ―Do State Owned Banks Promote Growth?
Cross-Country Evidence for Manufacturing Industries‖, Working Paper #483,
Research Department, Interamerican Development Bank. Also published in
Economics Letters, Vol. 84, 2004.
Gelos, Gastón and Alejandro Werner (1999), ―Financial Liberalization, Credit Constraints
and Collateral: Investment in the Mexican Manufacturing Sector‖, IMF Working
Paper WP/99/25, International Monetary Fund, March.
32
33. Grupo DFC (2002), ―Acceso de las pequeñas y medianas empresas al financiamiento‖,
Informe de Trabajo, Interamerican Development Bank, March.
Hallberg, Kristin (2001), ―A Market-Oriented Strategy for Small and Medium-Scale
Enterprises‖, Discussion Paper Number 40, International Finance Corporation, The
World Bank, Washington, D.C.
Interamerican Development Bank, IDB (2004), Unlocking Credit: The Quest for Deep and
Stable Bank Lending, in Economic and Social Progress in Latin America, 2005
Report, Washington, D.C.
Interamerican Development Bank, IDB (2005), ―Public Banks Revisited‖, Ideas for
Development in the Americas (IDEA), Vol. 7, May-August.
Kane, Joseph (1975), Development Banking, Lexington Books, D.C. Heath and
Corporation, Lexington, Massachusetts.
Kane, Edward (1977), ―Good Intentions and Unintended Evil: The Case Against Selective
Credit Allocation‖, Journal of Money, Credit and Banking, Vol. 9, No. 1, Part 1,
February.
Levy, Eduardo, Alejandro Micco, and Ugo Panizza (2004), ―Should Government be in the
Banking Business? The Role of the State-Owned and Development Banks‖, Paper
Prepared for the Seminar Governments and Banks: Responsibilities and Limits,
Lima, Peru, March 28th.
Levy, Eduardo, Alejandro Micco and Ugo Panizza (2007), ―A Reappraisal of State-Owned
Banks‖, Economía, Vol. 7, No. 2, Spring.
McKinnon, Ronald (1973), Money and Capital in Economic Development, The Brookings
Institution, Washington.
Negrín, José Luis (2000), ―Mecanismos para Compartir Información Crediticia. Evidencia
Internacional y la Experiencia Mexicana‖, Documento de Investigación 2000-05,
Banco de México, December.
Ponssard, Jean-Pierre (1979), ―The Strategic Role of Information on the Demand Function
in an Oligopolistic Environment‖, Management Science, Vol. 25, No. 3, March.
33
34. Raghavan, Vikram and Thomas Timberg (1982), ―Notes on Financing Small-Scale
Enterprises‖, in Diamond, William and Vikram Raghavan (Editors), Aspects of
Development Bank Management, EDI Series on Economic Development, The
Economic Development Institute of the World Bank and The Johns Hopkins
University Press, Washington.
Rodríguez-Meza, Jorge (2004), ―Debtor Enhancement Policies‖, Mimeo, The Ohio State
University, June.
Rojas, Mariano and Luis Rojas (1999), ―Costo de Transacción y Discrecionalidad en la
Asignación del Crédito Preferencial en México‖, El Trimestre Económico,
Vol. LXVI, No. 262.
Sapienza, Paola (2004), ―The Effects of Government Ownership on Bank Lending‖,
Journal of Financial Economics, No. 72.
Saurina, Jesús and Carlos Trucharte (2004), ―The Impact of Basel II on Lending to Small-
and Medium-Sized Corporations: A Regulatory Policy Assessment Based on
Spanish Credit Register Data‖, Journal of Financial Services Research, Vol. 26,
No. 2.
Stiglitz, Joseph and Andrew Weiss (1981), ―Credit Rationing in Markets with Imperfect
Information‖, The American Economic Review, June.
Stiglitz, Joseph (1994), ―The Role of the State in Financial Markets‖, Research Report No.
14334, Proceedings of the World Bank Annual Conference on Development
Economics 1993, World Bank, March.
Suwanaporn, Chodechai (2003), Determinants of Bank Lending in Thailand: An Empirical
Examination for the Years 1992 to 1996, Peter Lang Frankfurt, Frankfurt.
United Nations (2005), ―Rethinking the Role of National Development Banks‖,
background document for the Ad Hoc Expert Group Meeting, Rethinking the Role of
National Development Banks, United Nations, New York, December 1-2.
Van Hemmen, Esteban (2002), ―Restricción de crédito bancario en economías emergentes:
El caso de la PYME en México‖, Document de Treball núm 2002/6, Departament
d’economia de l’empresa, Universitat Autònoma de Barcelona, Julio.
Vives, Xavier (1990), ―Trade Association Disclosure Rules, Incentives to Share
Information, and Welfare‖, Rand Journal of Economics, Vol. 21, No. 3, Autumn.
34
35. Voordeckers, Wim y Tensie Steijvers (2006), ―Business Collateral and Personal
Commitments in SME Lending‖, Journal of Banking and Finance, No. 30.
Werner, Martín (1994), ―La banca de desarrollo 1988-1994: balance y perspectivas‖,
Comercio Exterior, Vol. 44, No. 12. December.
World Bank (2008), Finance for All? Policies and Pitfalls in Expanding Access, World
Bank Policy Research Report, Washington, D. C.
35
36. Figure 1. Banking System Commercial Loans to Private Sector by Size 2007-2008 */
MICRO SMALL
160 50
141 44
140 136 45
40 37 35
120
35
100 30 29
80 25
60 20
34 15
40
27 10
20 5
0 0
2007 2008 2007 2008
Commercial Banks Development Banks Commercial Banks Development Banks
MEDIUM LARGE
350 309 700
580
300 600
263
250 500
411
200 400
150 300
100 200
104
50 100 76
0.755
0.975
0 0
2007 2008 2007 2008
Commercial Banks Development Banks Commercial Banks Development Banks
*/ Real stocks in thousands of millions of pesos as of December 2007 and December 2008 (pesos of December 2007).
Note the changes in the scale of each section in the figure.
Figure 2. Number of Observations by Size 2007-2008 */
MICRO SMALL
800 200
178
690 180
700
147
560 160
600
525 140
466
500 120
400 100 82
300 80
61
60
200
40
100 20
0 0
2007 2008 2007 2008
Commercial Banks Development Banks Commercial Banks Development Banks
36
37. MEDIUM LARGE 113
120 120
104
100 100
88 86
80 80
63
60 60 52
40 40
20 20
0.597
0.626
0 0
2007 2008 2007 2008
Commercial Banks Development Banks Commercial Banks Development Banks
*/ Thousands as of December 2007 and December 2008. Note the changes in the scale in each section of the figure.
Figure 3. Banking System Average Commercial Loan to Private Sector by Size 2007-2008 */
MICRO SMALL
0.35 0.7
0.30 0.60
0.30 0.6 0.54
0.26
0.25 0.5
0.20 0.4
0.3 0.24
0.15
0.10 0.2 0.16
0.06
0.04 0.1
0.05
0.0
0.00
2007 2008
2007 2008
Commercial Banks Development Banks
Commercial Banks Development Banks
MEDIUM LARGE
3.5 10 9.17
2.99 2.97
9
3.0 7.89
8
2.5 7
2.0 6
1.56 5
1.27
1.5 4
1.0 3
2 0.92
0.5 0.89
1
0.0 0
2007 2008 2007 2008
Commercial Banks Development Banks Commercial Banks Development Banks
*/ Real stocks in millions of pesos as of December 2007 and December 2008 (pesos of December 2007).
Note the changes in the scale in each section of the figure.
37
38. Table 1. Removed Observations as of December 2007
VARIABLE BY REASON OF:
Size 14,273 observations (0.8% out of the total) referred to loans granted to government entities or
agencies (all of which are of no interest to this study).
Age 895 observations (0.05% out of the total) showed a format incompatible with the calculation of the
borrower’s age.
Debtor The development banks’ side of the data base included an extreme observation: a single huge loan
($1’090.9 millions) granted to a person.
Location There were 70,900 observations (4.2% out of the total) for which it was not possible to determine
the borrower’s location. On the other hand, 1,033 observations (0.06% out of the total)
corresponded to borrowers located abroad. Both groups are of no interest to this study.
Activity It was impossible to determine the borrower’s sector of activity in 639 observations. Besides,
14,638 corresponded to government activities, all of which are of no interest to this study.
Purpose In 14,936 observations it was impossible to determine the loan’s purpose.
Table 2. Number of Observations on the Corrected Data Base by Size as of December
2007 2008
Size Development Commercial Development Commercial
Banks Banks Total Banks Banks Total
Micro 647 255,220 255,867 644 243,330 243,974
Small 4,149 8,270 12,419 3,870 11,752 15,622
Medium 119 32,292 32,411 207 36,270 36,477
Large 1,757 11,531 13,288 1,970 21,512 23,482
Total 6,672 307,313 313,985 6,691 312,864 319,555
Table 5. Existence of Collateral by Activity, December 2007
Activity
Agriculture Mining Manufacturing Industry Trade Services Financial
Yes 775 313 14,225 8,988 52,332 58,405 15,490
No 132,682 98 4,716 3,806 9,964 8,115 4,076
38
39. Table 3. Variables Description
Unit of Measure /
Variable Specification Description
Loan’s Balance Pesos Indicates the outstanding total amount of the loan as of the end of the month. The balance includes
(Balance) capital and interests.
Financial Percentage Indicates the spread between the gross annual interest rate of the loan minus the average annual
Margin rate of funding for each type of bank. On December 2007, the corresponding rate of funding to
(margin) commercial banks (Costo de Captación a Plazo de los Pasivos en Moneda Nacional) averaged
6.24%, while development banks’ average rate of funding (Tasa de Interés de los Pasivos a Plazo
en Moneda Nacional) reached 7.67%.
Borrower’s Age Days The borrower’s age was calculated subtracting from the last day of 2007 (December 31th 2007),
(Age) the date read on the Federal Taxpayers' Registry, that is, the ―Registro Federal de Contribuyentes‖
(RFC). The RFC usually contains the date on which the person was born or the corporation made a
start.
Loan’s Term Days The term of the loan was calculated subtracting from its expiration date the date when it was
(Term) outlaid.
Borrower’s Categories 0-6 Indicates the borrower’s main sector of economic activity. Each sector of economic activity (that
Sector of is, each category of Activity) was related to a specific number: 0 for Agriculture; 1 for Mining; 2
Activity for Manufacturing; 3 for Industry; 4 for Trade; 5 Services; 6 for Financial Sector. Government
(Activity) activities were removed and agriculture was taken as the base category.
Type of Bank Categories 0-1 Development banks were grouped in the base category so number 0 was related to development
(Bank) (dummy variable) banks and number 1 to commercial banks.
Type of Debtor Categories 0-1 There exist two formats for RFC: the first one contains 12 characters and corresponds to persons.
(Debtor) (dummy variable) The second format contains 13 characters and refers to corporations, corporations or corporations.
The base category (number 0) was assigned to persons and number 1 to corporations.
Borrower’s Size Categories 0-3 Indicates the borrower’s size according to the following criteria: 0 for micro; 1 for small; 2 for
(Size) medium and 3 for large. Government entities or agencies were excluded and small was taken as the
base category.
Loan’s Purpose Categories 0-2 Different loan purposes were grouped in short, medium or large terms, and restructuring, according
(Purpose) to their aim or nature. Therefore, the following categories were included: 0 (short term) for
working capital, sales financing, no specific purposes, etc.; 1 (medium or large) for fixed asset,
infrastructure, real state, imports, etc., and 2 (restructure) for debt restructuring. Short term was
taken as the base category.
Borrower’s Categories 0-1 Base category (number 0) was set to rural location and number 1 to urban location.
Location (dummy variable)
(Location)
Existence of Categories 0-1 Number 0 was set to loans for which there was no collateral and number 1 for those that exhibited
Collateral (dummy variable) collateral. Lack of collateral was taken as the base category.
(Collateral)
Table 4. Pearson’s Correlation between Variables, December 2007 2008 */
20072008 margin size bank collateral debtor age Activity location term purpose balance
margin 1 -0.362 0.193 -0.592 -0.672 -0.084 0.476 0.190 -0.512 -0.494 -0.050
size -0.406 1 -0.156 -0.199 0.210 -0.481 0.314 0.123 -0.079 -0.340 0.074
bank 0.209 -0.190 1 0.140 -0.072 0.148 -0.185 -0.047 0.059 0.055 -0.006
collateral -0.584 -0.124 0.153 1 0.468 0.507 -0.755 -0.305 0.685 0.787 -0.010
debtor -0.623 0.177 0.231 0.556 1 -0.133 -0.486 -0.180 0.393 0.465 0.022
age -0.095 -0.492 0.158 0.517 -0.026 1 -0.580 -0.230 0.395 0.599 -0.040
activity 0.486 0.309 -0.203 -0.776 -0.552 -0.61 1 0.336 -0.568 -0.818 0.024
location -0.191 -0.118 0.049 0.303 0.199 0.233 -0.332 1 -0.240 -0.327 0.006
term -0.531 -0.088 0.039 0.754 0.471 0.433 -0.630 0.257 1 0.666 0.016
purpose -0.510 -0.313 0.054 0.796 0.507 0.614 -0.826 0.323 0.721 1 -0.023
balance -0.042 0.072 -0.003 -0.012 0.015 -0.03 0.022 -0.007 0.011 -0.022 1
*/ Statistically significant at 95% of confidence.
39
40. Table 6a. ANOVA for margin, December 2007
Mean
Differences
Variable Category Median Mean (base category Number of
minus each of Observations
the rest) 1/
margin All 8.11 11.33 0.0 313,985
Size Micro 8.22 12.57 0.0 255,867
Small 4.96 5.18 7.39 12,419
Medium 6.66 6.51 6.07 32,411
Large 3.76 4.83 7.74 13,288
Bank Development 1.80 2.65 0.0 2 / 6,672
Commercial 8.11 11.52 -8.87 2 / 307,313
Collateral No 17.76 15.04 0.0 2 / 150,528
Yes 7.94 7.91 7.13 2 / 163,457
Debtor Person 20.26 17.36 0.0 2 / 89,291
Corporation 7.96 8.93 8.43 2 / 224,694
Activity Agriculture 7.96 7.83 0.0 133,457
Mining 6.66 9.83 -1.99 411
Manufacturing 7.76 9.96 -2.12 18,941
Industry 7.66 10.67 -2.83 12,794
Trade 17.76 15.11 -7.27 62,296
Services 18.76 16.33 -8.49 66,520
Financial 5.25 7.93 -0.09 19,566
Location Rural 7.94 8.20 0.0 2 / 38,186
Urban 8.15 11.76 -3.56 2 / 275,799
Purpose Short Term 17.76 14.20 0.0 172,214
Medium/Long 7.95 7.81 6.39 140,532
Restructure 11.76 11.17 3.03 1,239
Age (ranges Up to 1 7.25 7.27 0.0 330
in years) 1-2 6.66 7.89 -0.63 1,465
2-5 12.76 12.58 -5.32 18,682
5-10 10.98 11.51 -4.24 28,362
10-15 6.66 7.66 -0.39 24,519
15-20 6.66 8.31 -1.05 11,070
More than 20 8.10 11.77 -4.50 229,557
Term (ranges Up to 1 16.76 12.55 0.0 54,480
in years) 1-2 19.76 17.55 -5.0 86,118
2-5 7.94 7.89 4.66 169,436
5-10 5.89 6.19 6.36 3,317
10-15 6.35 6.45 6.10 483
15-20 5.71 4.73 7.83 71
More than 20 3.76 3.23 9.33 80
1
/ Based on the Scheffé post hoc test. All mean differences were significant at 99% of confidence.
2
/ Based on the t-test of mean differences at 99% of confidence.
40
41. Table 6b. ANOVA for margin, December 2008
Mean
Differences
Variable Category Median Mean (base category Number of
minus each of Observations
the rest) 1/
margin All 7.15 10.94 0.0 319,555
Size Micro 7.30 12.45 0.0 243,974
Small 5.79 5.50 6.95 15,622
Medium 5.70 5.44 7.01 36,477
Large 6.30 7.32 5.13 23,482
Bank Development 1.35 2.12 0.0 2 / 6,691
Commercial 7.16 11.12 -9.0 2 / 312,864
Collateral No 18.80 14.72 0.0 2 / 166,343
Yes 6.98 6.82 7.90 2 / 153,212
Debtor Person 19.30 18.17 0.0 2 / 88,489
Corporation 6.98 8.16 10.01 2 / 231,066
Activity Agriculture 7.00 6.85 0.0 120,498
Mining 8.80 11.42 -4.57 371
Manufacturing 6.55 9.00 -2.14 21,102
Industry 5.78 9.55 -2.70 14,416
Trade 18.80 14.67 -7.82 63,016
Services 18.80 15.97 -9.11 80,324
Financial 3.45 6.54 0.31 19,828
Location Rural 6.99 7.39 0.0 2 / 36,156
Urban 7.26 11.39 -4.00 2 / 283,399
Purpose Short Term 16.80 13.66 0.0 191,214
Medium/Long 6.98 6.83 6.83 126,956
Restructure 9.80 9.64 4.03 1,120
Age (ranges Up to 1 5.80 5.31 0.0 238
in years) 1-2 5.70 5.45 -0.14 3/ 1,428
2-5 10.45 11.22 -5.91 16,265
5-10 11.80 11.55 -6.24 33,259
10-15 6.01 8.36 -3.04 25,654
15-20 5.70 7.96 -2.65 14,243
More than 20 7.15 11.34 -6.03 228,468
Term (ranges Up to 1 5.54 6.78 0.0 34,928
in years) 1-2 19.30 18.49 -11.72 107,163
2-5 7.00 7.22 -0.44 171,825
5-10 5.70 6.38 0.40 4,917
10-15 5.39 5.84 0.93 578
15-20 4.75 4.20 2.57 62
More than 20 2.80 1.69 5.01 82
1
/ Based on the Scheffé post hoc test. All mean differences were significant at 99% of confidence.
2
/ Based on the t-test of mean differences at 99% of confidence.
3
/ The difference were not statistically significant.
41